Consider a radar is measuring the range and bearing of an object, whose true position in Cartesian coordinates is at [x=1, y=0]. The radar measurements are noisy, where the range and bearing noise are statistically independent white Gaussian noise with a range deviation of 4cm and a bearing deviation of 15 degrees. The situation is depicted in the following figure.
Measuring the position of the object in the polar coordinate system, i.e. the radar's coordinate system, and converting it to the Cartesian coordinates is a common practice in many applications. Lerro and Bar-Shalom [1] have analytically shown that if the range and bearing measurements are corrupted by noise, the transformed position in Cartesian coordinates exhibits a statistical bias. With the knowledge of the analytically derived bias, this example can be used to test various approximation techniques, such as the Extended Kalman Filter and the Unscented Filter. If you are skeptic about the bias, generate a sequence of random range and bearing measurements and perform the transformation. The mean will exhibit a negative bias and the covariance matrix will also be distorted. The next figure shows the result of this Monte Carlo simulation.
The above figure also shows the result of the Extended Kalman filter (EKF). The EKF approximates the nonlinear transformation by a Taylor series of first or second order, such that the estimated position is at [x=1 y=0] and the covariance estimate becomes to conservative.
The Unscented filter samples the range-bearing system at distinct values based on the algorithm used. The following figure shows the selection of the sigma-set for the standard Unscented filter and the higher order unscented filter. These sigma-sets are propagated through the polar-to-cartesian transformation and based on the weighted sequence the mean and variance of the Cartesian coordinates are calculated.
The results are shown in the following figure, which compares the standard Unscented filter (UKF) and the higher order unscented filter (HUOF) with the aforementioned Monte Carlo simulation.
The estimate of the HOUF in fact, more accurately approximates the statistical bias and the covariance ellipse closely approximates the covariance of the Monte Carlo simulation. Note, that the Monte Carlo simulation also shows a bias in the y-direction, which is due to the limited number of Monte Carlo runs. By carrying out the analytical solution of the bias as shown in Lerro and Bar-Shalom, it can be seen that there is no bias in the y-direction.
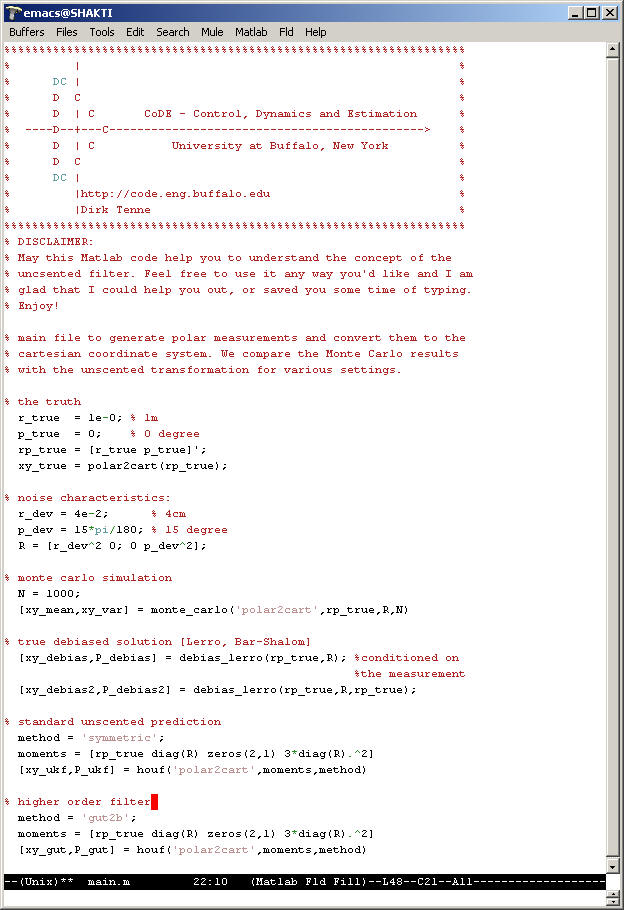
The MATLAB code to reproduce the presented results can be found at the following links. Please refer to the main.m which calls the desired functions.
| main.m | ||
 |
||
| Subfunctions | polar2cart.m |